
If data is the new oil, did you know that you can extract it from your Learning management system (LMS) to fuel your organization’s training goals? Analogically, this oil refers to learning analytics. This article will show what data can be collected from a learning platform and how this learning analytics will help the organization’s training program.
Introduction
The learning management system can be a mirror of its own performance. While the LMS hosts and launches courses and manages the learning journey, it can also be a treasure house of learning analytics. This big data records, measures, and analyses information about the learner vis-a-vis the course. This includes the following.
What Big Data Can be Collected from LMS
Assessment Scores
The basic measurable data are the scores that are added up from various knowledge checks and gamification levels. While a high score means good performance, it may also indicate that the difficulty level is low. Lower scores might not always mean an ineffective course. It could also indicate that the course is well-designed to cater to a pressing knowledge gap.
Learner Performance and Progress
Data like the number of courses, learning paths, surveys completed, etc. are critical for defining the direction of the training goals.
LMS analytics provide insight into the learning behavior of the users. One can get to know the number of courses completed in a learning journey and the speed at which it was completed.
If someone is slow on the learning path, one can assess whether they found the course unengaging or lacked time.
Surveys and Feedback
Likes and dislikes about the course and examples shared during peer discussion can be a goldmine.
Most learning management systems provide a collaborative environment. Learners can discuss topics and share feedback about the learning experience. These can be eye-openers, giving the organizations and the learning solution partner an insight into the trends and the cognitive and affective aspects of the behavior.
Others
Beyond reports, the data that can be taken from LMS are:
- Learning data generated by xAPI and non-xAPI (typically SCORM-based) eLearning courses.
- Learning path and course assignments along with completions and results.
- Search terms if the LMS supports this functionality.
- Interactions on discussion forums.
The LMS could be of the organization or the eLearning partner. The organization could cover corporations, business schools, K-12, and government departments.
Analytics Types
Learner Analytics
Some relevant data are related to users, including individual learners, departments, or groups.
Learning Experience Analytics
Some of the insights include:
- Whether the learner has taken less or more time to complete a course.
- Number of times remediation and memory boosters were availed.
- How many times has a learner revisited the previous screens.
These data can determine whether the course is challenging, easy, or disengaging.
When it comes to learning analytics from the LMS, two questions arise. What data can be extracted, and how can it help the organizations curate a training program?
Relevant data collection can have an impact on the development of the training program and the learning outcomes. The benefits include:
- Measurement of the learning effectiveness both for the team and the individual.
- Improvement of the learning experience with the information that serves as a guide to the actions.
- Analyses of the impact on the business.
- Understanding the learning trends
- Track the library of resources to aid learning.
- Customize, personalize, and adapt the eLearning course.
Case Study – KREDO Learning Analytics.
Data, data everywhere, but no insights to be seen. Here is where LMS Reports come in.
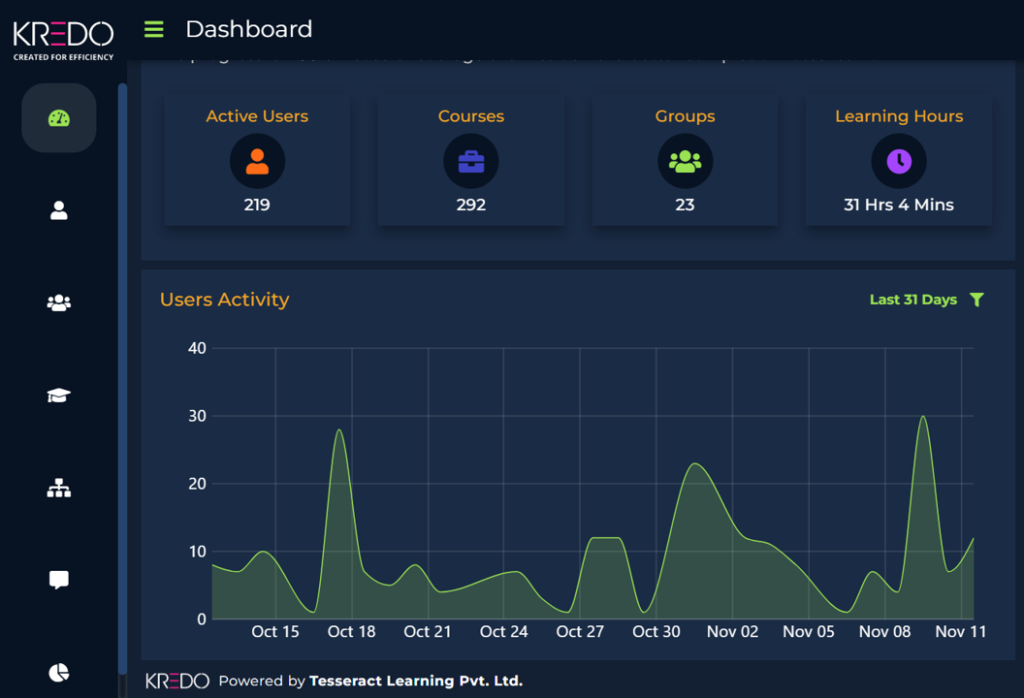
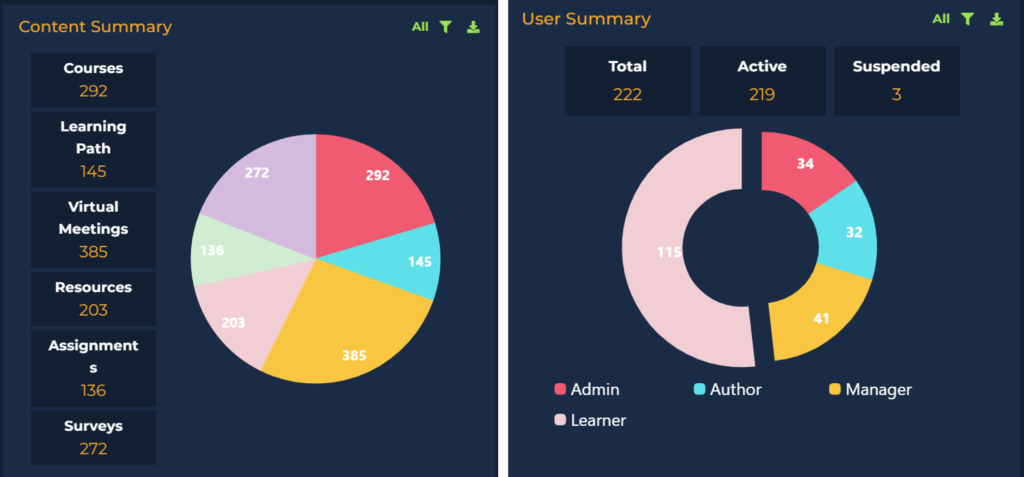
KREDO provides holistic data about learners and their performance.
It helps one capture user, content, and course summary. Get a quick overview of active users, learning hours, and the number of users active per day through the KREDO dashboard.
The discussion forum is an excellent place to get the pulse of what the learners are discussing and how they are doing it. Not only does one get to know about their perception of the course, but also ideas for scenarios and interactivity. Get feedback on anything through the surveys.
The reports include assignments, skills, learning paths, and group summaries. There are customized reports too.

Conclusion
Thomas Redman, a data expert, said, “where there is data smoke, there is business fire.” In this context, I would put it as where there is data smoke, the learning is on fire. A dynamic and effective learning platform generates relevant and authentic learning analytics.
Enrich your corporate training strategy using the learning platform KREDO. It is not only Simple to Create, Smart to Express, and Effortless to learn, but it is also a rich source of information that can help to improve the outcomes of your training program.
It is a confluence of technology and communication, creativity and simplicity, purpose and fun, individual empowerment and corporate excellence.
If creating a culture of learning in your organization is your priority, contact us or write to me at meetaa@tesseractlearning.com.